
WARREN INSIGHTS · OPERATIONS · FINANCIAL MODELING
What Is Your Square Foot of Floor Space Really Costing You?A worked example of real estate, continuous staffing and utilities—and how a small operational improvement can recover the cost of an engagement.
Every business pays for space, labor and utilities. Those expenses arrive as separate bills, but they combine to create the cost of keeping the operation running. Looking at those expenses per square foot of productive merchandise space can make the economics easier to understand.
This article develops an illustrative convenience-store model for southwest Washington. It is a transparent planning example, not a claim that every local store has these costs. Where public industry data are available, they are identified; where assumptions are used, they are labeled.
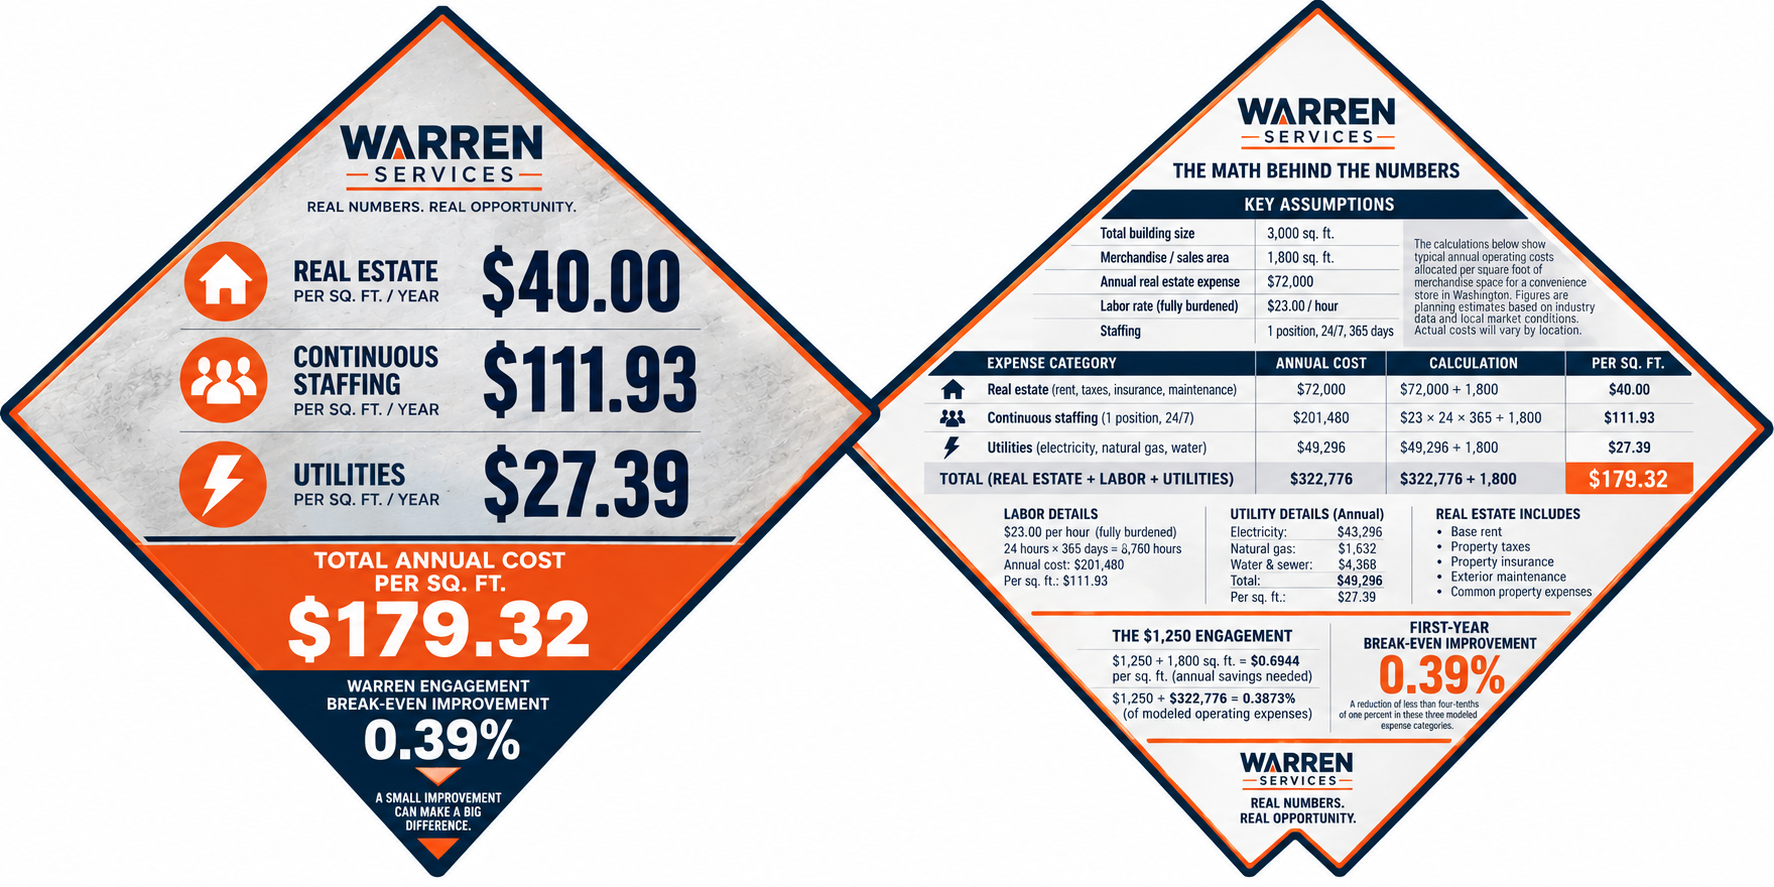
Proposed front and back of the 12-inch WARREN Services demonstration tile. QR code intentionally omitted until the article is approved and its final URL is established.
The example store
Assumption
Value
Total building
3,000 sq. ft.
Merchandise and sales area
1,800 sq. ft.
Annual occupancy expense
$72,000
Fully burdened labor planning rate
$23/hour
Staffing model
One position continuously staffed
The 1,800-square-foot merchandise and sales area is an assumed usable-area estimate after excluding non-merchandising areas such as restrooms, office, storage, receiving and circulation. It is not a measured industry average. A real analysis should use a floor plan and clearly define which areas are included.
1. Real estate: $40.00 per square foot
For this model, annual occupancy expense is set at $72,000. This is a working estimate selected for the example, not a verified average lease rate for southwest Washington.
$72,000 ÷ 1,800 sq. ft. = $40.00 per merchandise sq. ft. per year.
2. Continuous staffing: $111.93 per square foot
One continuously staffed position requires 24 × 365 = 8,760 paid coverage hours per year. At the assumed fully burdened rate of $23 per hour:
8,760 × $23 = $201,480 annually.
$201,480 ÷ 1,800 sq. ft. = $111.93 per merchandise sq. ft. per year.
The $23 rate is a planning assumption, not a published average compensation figure. Actual employer cost depends on wage rates, payroll taxes, workers’ compensation, paid leave, benefits, overtime and scheduling. This calculation covers one position at all times; it does not represent the entire store workforce.
3. Utilities: $27.39 per square foot
The utility estimate uses a historical NACS convenience-retail energy survey category for expanded convenience stores in the 2,801–3,600-square-foot range. The monthly figures used in the model are $3,608 electricity, $136 natural gas and $364 water and sewer, totaling $4,108 per month.
$4,108 × 12 = $49,296 annually.
$49,296 ÷ 1,800 sq. ft. = $27.39 per merchandise sq. ft. per year.
These are historical national survey figures, not current southwest Washington utility bills. Actual use and cost vary with equipment, energy rates, building envelope, climate, operating hours and store format.
4. The combined model
Expense
Annual cost
Per merchandise sq. ft.
Real estate
$72,000
$40.00
Continuous staffing
$201,480
$111.93
Utilities
$49,296
$27.39
Total modeled expenses
$322,776
$179.32
The subtotal is $179.32 per merchandise square foot per year, or approximately $14.94 per month and $0.49 per day. It is a partial operating-cost allocation—not the complete cost of operating the store. It excludes many potential costs, including other labor, maintenance, waste, payment processing, supplies, security, equipment and inventory losses.
5. What does a $1,250 engagement need to return?
If an operational improvement engagement costs $1,250, the business must realize at least $1,250 in attributable savings or additional gross profit to recover that investment.
$1,250 ÷ 1,800 sq. ft. = $0.6944.
That is approximately 69 cents in first-year savings per merchandise square foot.
Compare the engagement price with the three modeled annual expense categories:
$1,250 ÷ $322,776 × 100 = 0.3873%, or 0.39% rounded.
Therefore, a reduction of approximately 0.39% in the combined real-estate, one-position staffing and utility expenses would recover the $1,250 engagement cost in the first year, assuming the savings are real, attributable, and realized during that year.
This percentage is not 0.39% of all store operating costs. It is calculated against only the three expense categories modeled here. Adding other eligible expenses to the denominator would change the percentage, but only after ensuring categories do not overlap.
6. What if the improvement comes from additional sales?
Revenue is not the same as profit. To recover $1,250 through increased sales, the store needs enough additional gross profit to cover the engagement. At an assumed 30% gross margin:
$1,250 ÷ 0.30 = $4,166.67 in additional annual sales, equivalent to approximately $2.31 per merchandise square foot.
Assumed gross margin
Additional annual sales needed
Sales per sq. ft.
20%
$6,250
$3.47
25%
$5,000
$2.78
30%
$4,166.67
$2.31
35%
$3,571.43
$1.98
40%
$3,125
$1.74
50%
$2,500
$1.39
These are illustrative calculations. Actual incremental contribution depends on product mix, discounts, payment fees, shrink, labor and other variable costs—not gross margin alone.
7. Where might improvement come from?
Opportunities can include reducing avoidable labor, improving stocking and replenishment, reducing spoilage and damage, improving inventory accuracy, eliminating redundant work, preventing rework, reducing unnecessary product handling, and improving refrigeration or lighting practices. Several modest improvements can combine to produce a meaningful result.
The important work is to establish a baseline, identify the underlying cause, select a practical countermeasure, and verify that the result persists. A recommendation is not a saving until the business can measure and sustain it.
8. Your location has its own numbers
A rural store and a high-traffic commercial location may have very different occupancy costs. Stores also differ in layout, operating hours, refrigeration, wages, product mix and sales. Public industry benchmarks are useful starting points, but they cannot replace the business’s own records.
With actual rent and occupancy costs, payroll, utility bills, insurance policies, sales and gross-margin data, WARREN Services can help calculate the economics of the individual operation: cost per merchandise square foot, labor cost per hour of coverage, gross profit per square foot, and the financial impact of specific inefficiencies.
The WARREN Services perspective
Operational improvement does not always require a dramatic transformation. It can begin by finding small, recurring losses that have become part of the routine. In this example, recovering a $1,250 engagement requires approximately 69 cents of first-year savings per merchandise square foot—or a 0.39% reduction in the three modeled expense categories.
The figures are not a promise of results. They illustrate how to frame the opportunity, establish a measurable target, and evaluate whether an improvement is worth pursuing.
Every square foot costs money. Every employee hour costs money. The opportunity is to make more of the resources a business already pays for.
Sources and methodology
National Association of Convenience Stores (NACS), Convenience Retail Energy Use Survey, conducted with the U.S. Environmental Protection Agency’s ENERGY STAR program. Historical utility benchmarks for expanded convenience stores, 2,801–3,600 sq. ft. The model uses the stated monthly electricity, natural gas and water/sewer figures. NACS energy-use survey PDF.
U.S. Bureau of Labor Statistics, Occupational Employment and Wage Statistics. Wage data can provide a local occupational wage reference, but the $23 fully burdened hourly rate used here is an explicit modeling assumption and is not presented as a BLS-reported employer cost. BLS Occupational Employment and Wage Statistics.
Real estate occupancy: $72,000 annual expense is a working model assumption selected for this example, not a published local market average.
Merchandise area: 1,800 sq. ft. is an assumed allocation base, not a published convenience-store average. A location-specific measurement should define and measure the selling/display footprint consistently.
All dollar amounts and calculations are illustrative. Historical survey data may not reflect current local prices. Each location should substitute its actual records and verify that expense categories are consistently defined and not double-counted.